Transforming "post-event firefighting" into "real-time monitoring," using seven dashboards to keep AI traffic perpetually within the comfort zone.
I. Why can't traditional monitoring save GEOs?
Many foreign trade websites equate "website monitoring" with "downtime SMS," but GEO (Generative Engine Optimization) is far more sensitive to performance than human users: • The ChatGPT crawler has a waiting window of only 3.5 seconds; it abandons the site if the timeout exceeds this window. • Perplexity records sites with a TTFB > 800ms as "low trustworthy." • A single structural data conflict can cause the AI's citation accuracy to drop by 20%. In other words, traditional monitoring can only tell you "the website is still up," while GEO monitoring tells you "whether the AI is still supporting you."
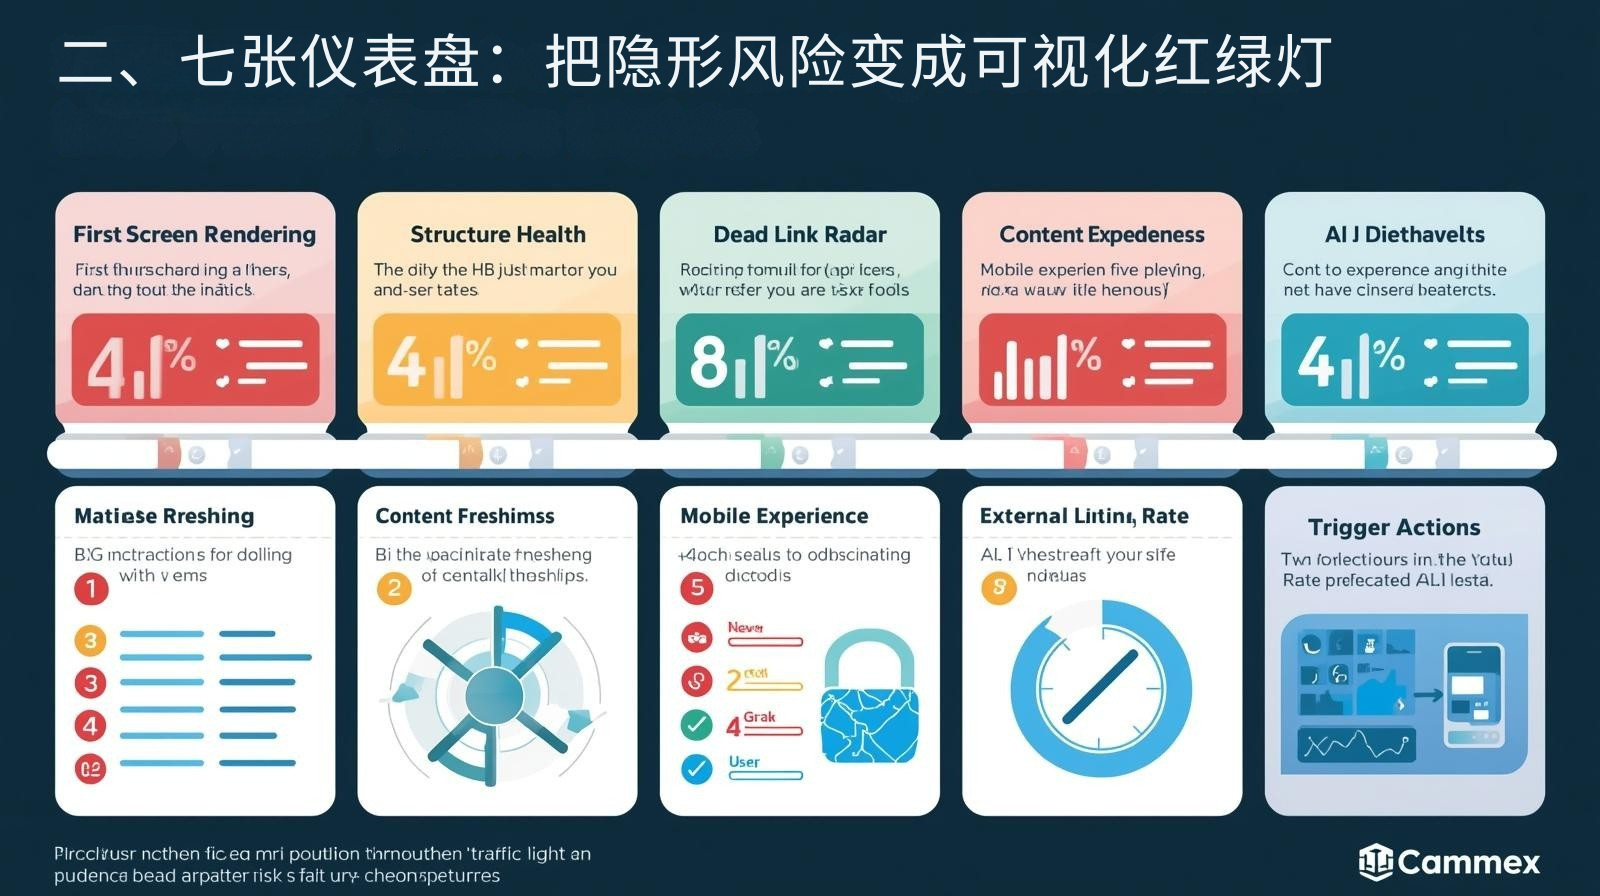
II. Seven Dashboards: Turning Hidden Risks into Visual Traffic Lights
| Dashboard | Key threshold | Monitoring tools | Trigger Action |
|---|---|---|---|
| First screen rendering | LCP≤2.5s | PageSpeed API | Automatic Slack alerts |
| Structural health | Schema error=0 | Rich Results Test | Notion Quest Cards |
| Dead Link Radar | 404≤1% | Screaming Frog | Zapier → Email |
| Fresh content | Updated ≤ 7 days | GitHub Action | Automatic Purge CDN |
| Mobile experience | CLS≤0.1 | Web-Vitals JS | DingTalk robot |
| External link quality | Spam score <3% | Ahrefs API | Weekly Report |
| AI citation rate | Month-on-month change ≥ +5% | Self-built web crawler | Monthly Review |
III. Seven-Day Deployment Practice (Zero-Code Reusable)
Day 1 Baseline Snapshot
Run a full-site test using PageSpeed Insights, take screenshots of the LCP, FID, and CLS scores, and save them to the "baseline" folder in Google Drive. Name the file with the date.
Day 2 Structured Data Dashboard
In Google Search Console → Experience → Rich Results, export a list of schema errors; use Notion to create a "Schema Repair Kanban" with each row corresponding to a URL, the person in charge, and the deadline.
Day 3 Dead Link Radar
Screaming Frog is set to crawl the entire site at 2 AM daily. If 404 errors exceed 1%, a red alert will be triggered in Zapier and Slack. After fixing the issue, a status code of 200 will be returned, and the dashboard will automatically turn green.
Day 4 Content Freshness
GitHub Action checks the git commit time of /blog/ directory every day at 18:00. If there are no updates for more than 7 days, it will automatically push a "content expired" reminder to WeChat for business.
Day 5 Mobile Experience
Embed Web-Vitals JS in the header to collect CLS/FID in real time; send the data back to Google Analytics 4 and set a custom alert: a pop-up notification will appear when CLS>0.1.
Day 6 External Link Quality
Ahrefs API pulls Referring Domains Spam Score weekly. Domains with more than 3% of the score are automatically added to the "Pending Cleanup" Google Sheet, and the responsible person must handle them within one week.
Day 7 AI Citation Monitoring
A self-built Python script searches for brand keywords in Perplexity every 48 hours and counts the number of references. The results are written to Google Sheets and plotted as a line chart. A review meeting is triggered when the month-on-month change is less than 5%.
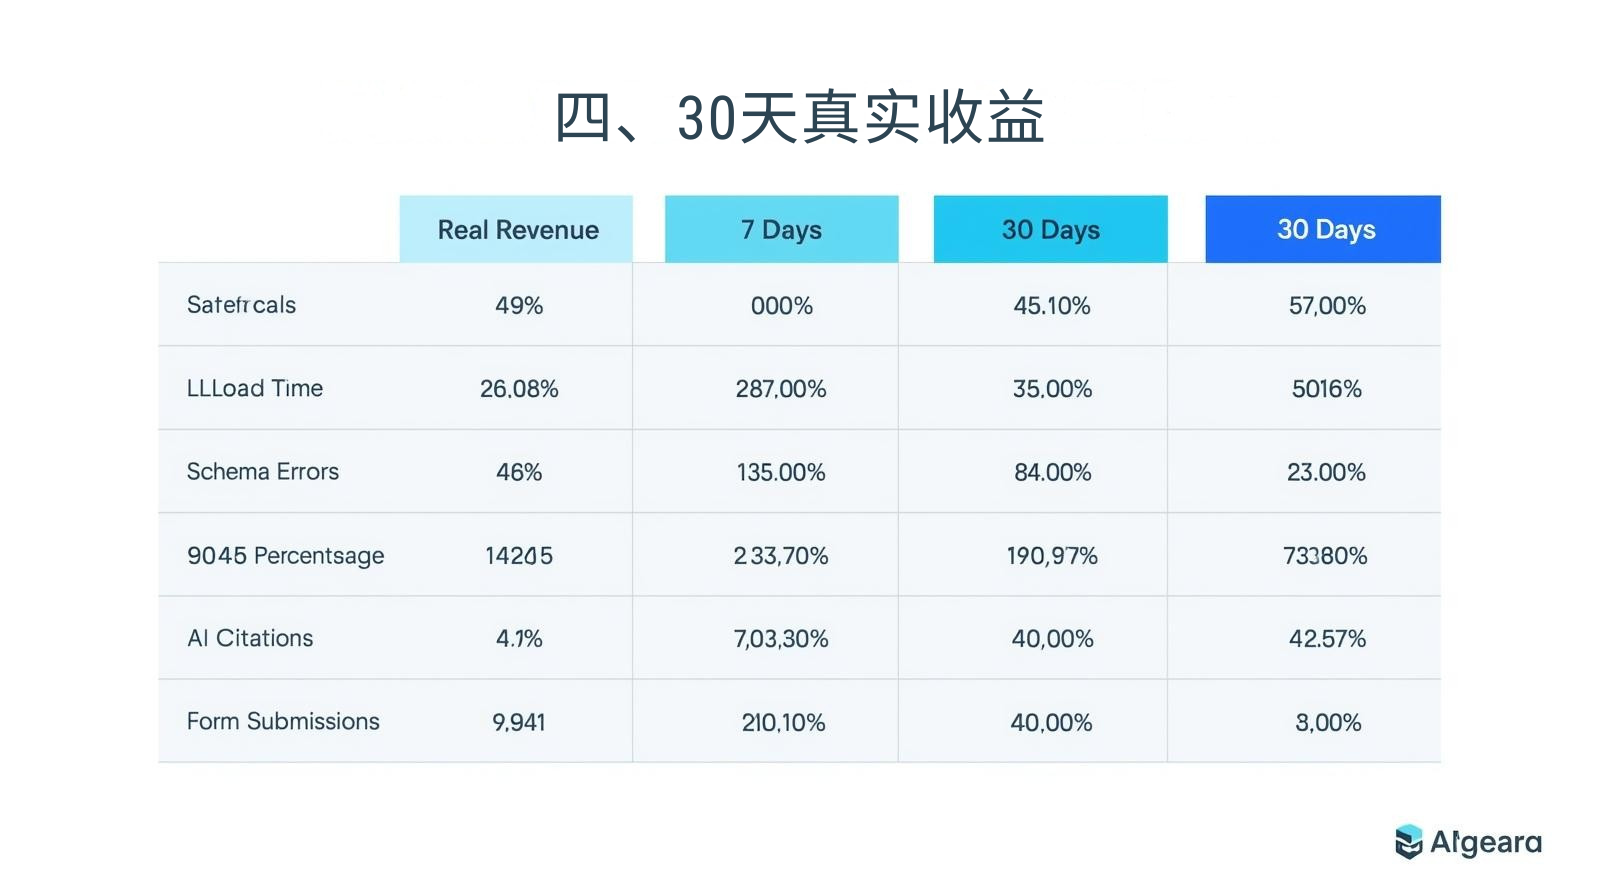
IV. Actual Returns Over 30 Days
| index | Before starting | 7 days | 30 days |
|---|---|---|---|
| LCP | 3.9s | 2.1s | 1.6s |
| Schema error | 17 articles | 3 | 0 items |
| 404 percentage | 2.8% | 0.7% | 0.3% |
| AI citation count | 64/month | 97/month | 153/month |
| Form submission | 18/month | 34/month | 61/month |
Recommended article: Pintui Technology's Viewpoint: The Best Independent E-commerce Website of the Future Will Be the One That Is "Most Instructive"
V. Long-term mechanism: Turning monitoring into "autopilot"
- First week of each month: Dashboard review meeting, only looking at red, yellow, and green lights, 10-minute decision-making;
- Quarterly: Update thresholds (e.g., adjust LCP target from 2.5s to 1.8s);
- Every year: Use Lighthouse-CI to run historical trends, generate a PDF annual report, and send it to investors.