In the cross-border e-commerce sector, data-driven independent websites boast conversion rates 47% higher than the industry average (source: McKinsey ). However, a survey by the China Council for the Promotion of International Trade ( CCPIT ) reveals that only 28% of foreign trade companies systematically utilize data for decision-making. This article will break down a three-step framework for data-driven decision-making and provide practical tools and methods for immediate implementation.
 Why is data-driven so important for independent websites?
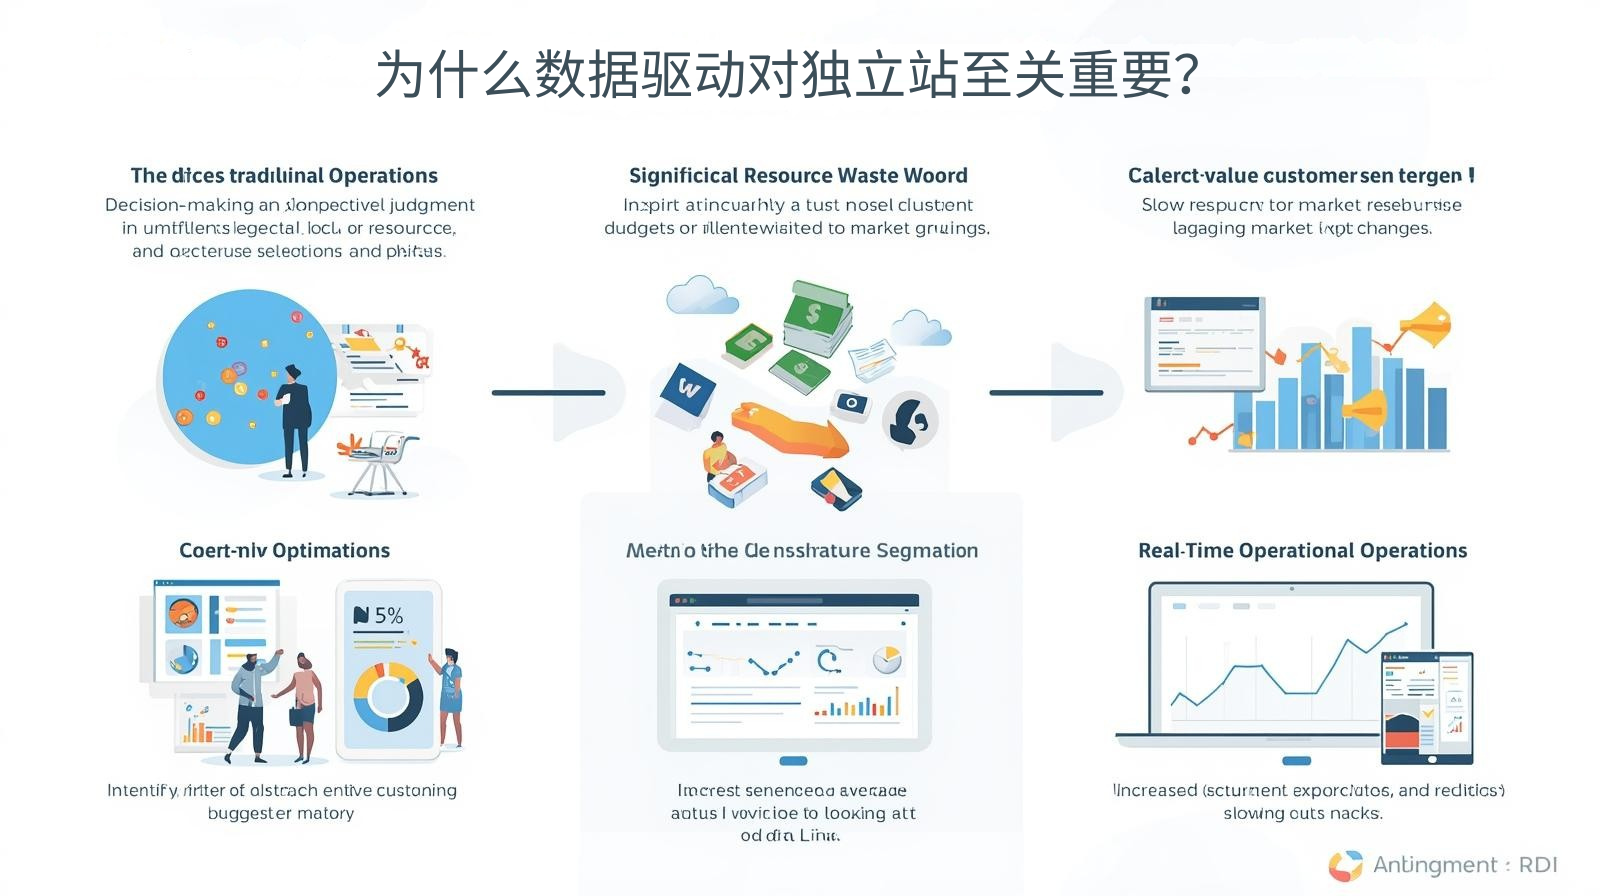
1. Three major pain points of traditional operations
- Decision-making based on experience : product selection and pricing rely on subjective judgment
- Serious waste of resources : 50% of advertising budgets cannot be tracked ( Google Analytics data)
- Slow reaction speed : Strategies are adjusted 3-7 days after market changes
2. Data-driven core value
- Identify high-value customer groups
- Predict market trend changes
- Real-time optimization of operational actions
Typical case : A Hangzhou clothing foreign trade station found through Pinshop's data dashboard that the average customer spending of German customers was 35% higher than the average. It then adjusted its marketing strategy and increased its ROI by 2 times.
STEP 1: Build a full-link data collection system
1. Five core data types that must be monitored
| Data Type | Collection tools | Application Scenario |
|---|---|---|
| User behavior data | Hotjar/Google Analytics | Optimize page layout |
| Transaction data | Shopify/Pinshop backend | Adjustment of product selection strategy |
| Traffic channel data | UTM parameters | Advertising ROI calculation |
| Competitive data | SimilarWeb | Market opportunity exploration |
| Supply chain data | ERP system | Inventory warning |
2. Three Principles of Data Collection
- Comprehensiveness : Covering the entire user journey from visit to repurchase
- Real-time : key indicators are delayed no more than 1 hour
- Accuracy : Setting data cleaning rules
STEP 2: Data Analysis and Insight Mining
1. Four-dimensional analysis method
① Funnel analysis
- Identify key churn links (e.g. payment page churn rate > 60% requires optimization)
② Crowd clustering
- Identifying high-value customers using the RFM model
- Comparison by region/device
③ Attribution Analysis
- Multi-touchpoint contribution evaluation (first click vs. last click)
④ Predictive Analysis
- Predicting the hot product cycle based on historical data
2. Recommended Practical Tools
- Free tools : Google Data Studio (visualization), Google Optimize (A/B testing)
- Paid tools : Tableau (deep analysis), Pinshop intelligent early warning system
A case study from the World E-Commerce Forum ( WEF ) shows that systematic analysis can increase decision-making accuracy by 80%.
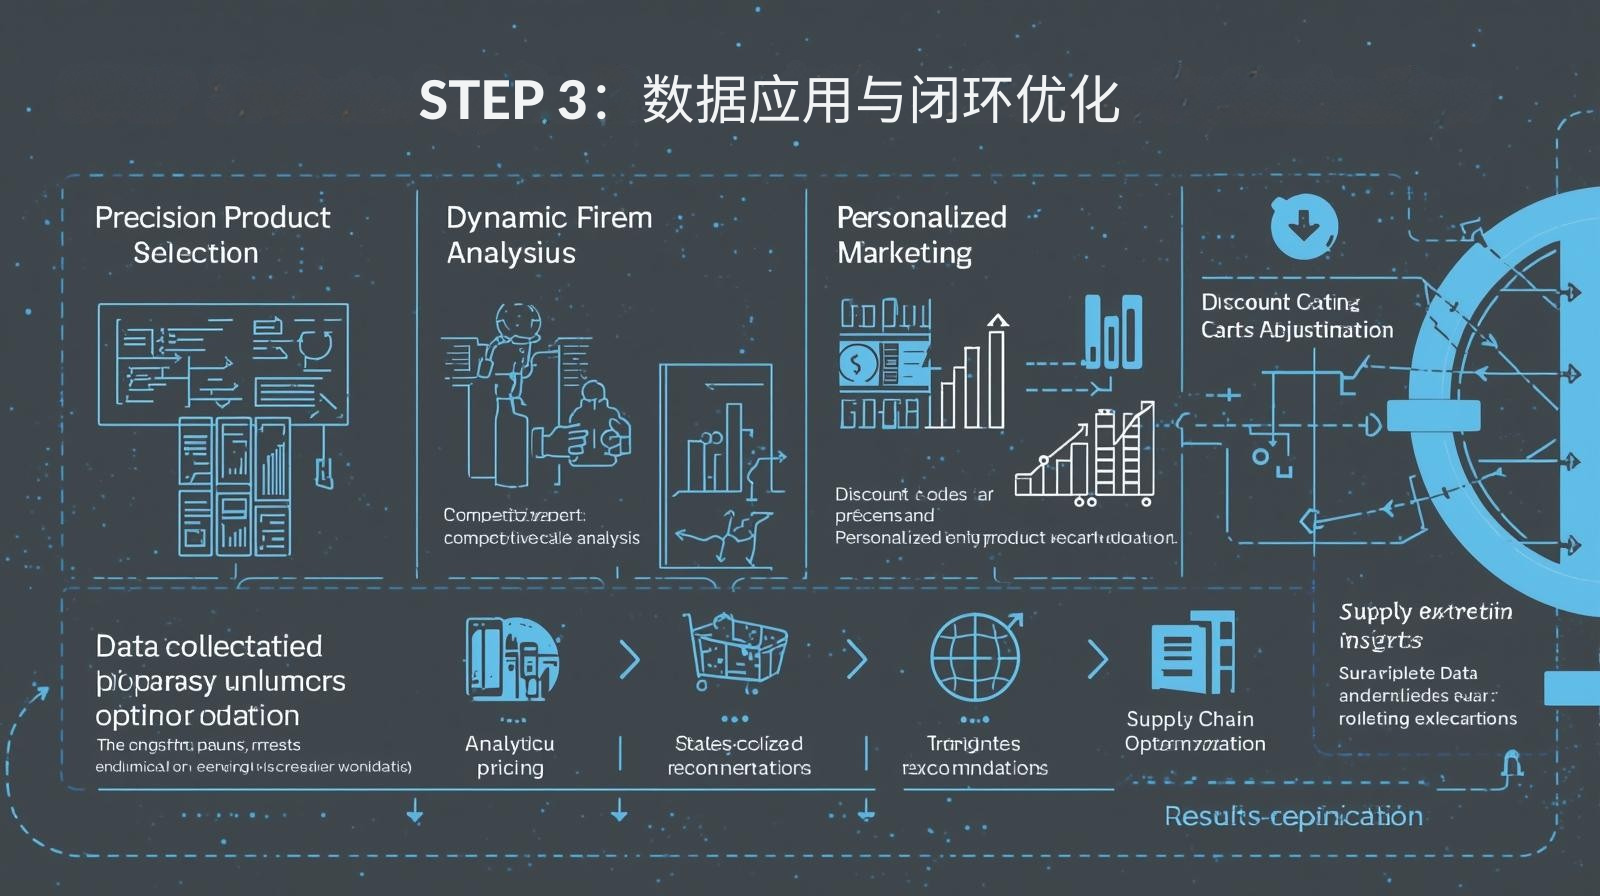 STEP 3: Data application and closed-loop optimization
1. Four Data-Driven Operational Scenarios
Scenario 1: Precise product selection
- Analyze search term reports to identify demand gaps
- Monitor competitor product sales rates
Scenario 2: Dynamic Pricing
- Automatic price adjustment based on supply and demand (e.g. 5% premium when inventory is less than 100 pieces)
Scenario 3: Personalized Marketing
- Push exclusive discount codes to unpaid users who have added items to their cart
- Recommend related products based on browsing history
Scenario 4: Supply Chain Optimization
- Sales forecast guides purchasing plans
- Logistics timeliness data analysis
2. Establish a closed loop of data feedback
Pinshop: Your data-driven website building partner
Why choose Pinshop :
✅ Built-in 10+ data report templates, one-click generation of analysis dashboard
✅ Integrate tools such as Google Analytics/Hotjar
✅ Automatic warning of abnormal data (such as a 30% drop in traffic)
Recommended related articles: Multilingual Independent Station Strategy: Balancing Localization and Internationalization