The average user dwell time on e-commerce platforms is only 2 minutes and 17 seconds, while a GEO-optimized visual system for independent websites is increasing this figure to 7 minutes and 43 seconds. This article will provide an in-depth analysis of how to construct a memorable brand immersion experience through location-intelligent visual storytelling, achieving a qualitative leap from traffic to loyalty.
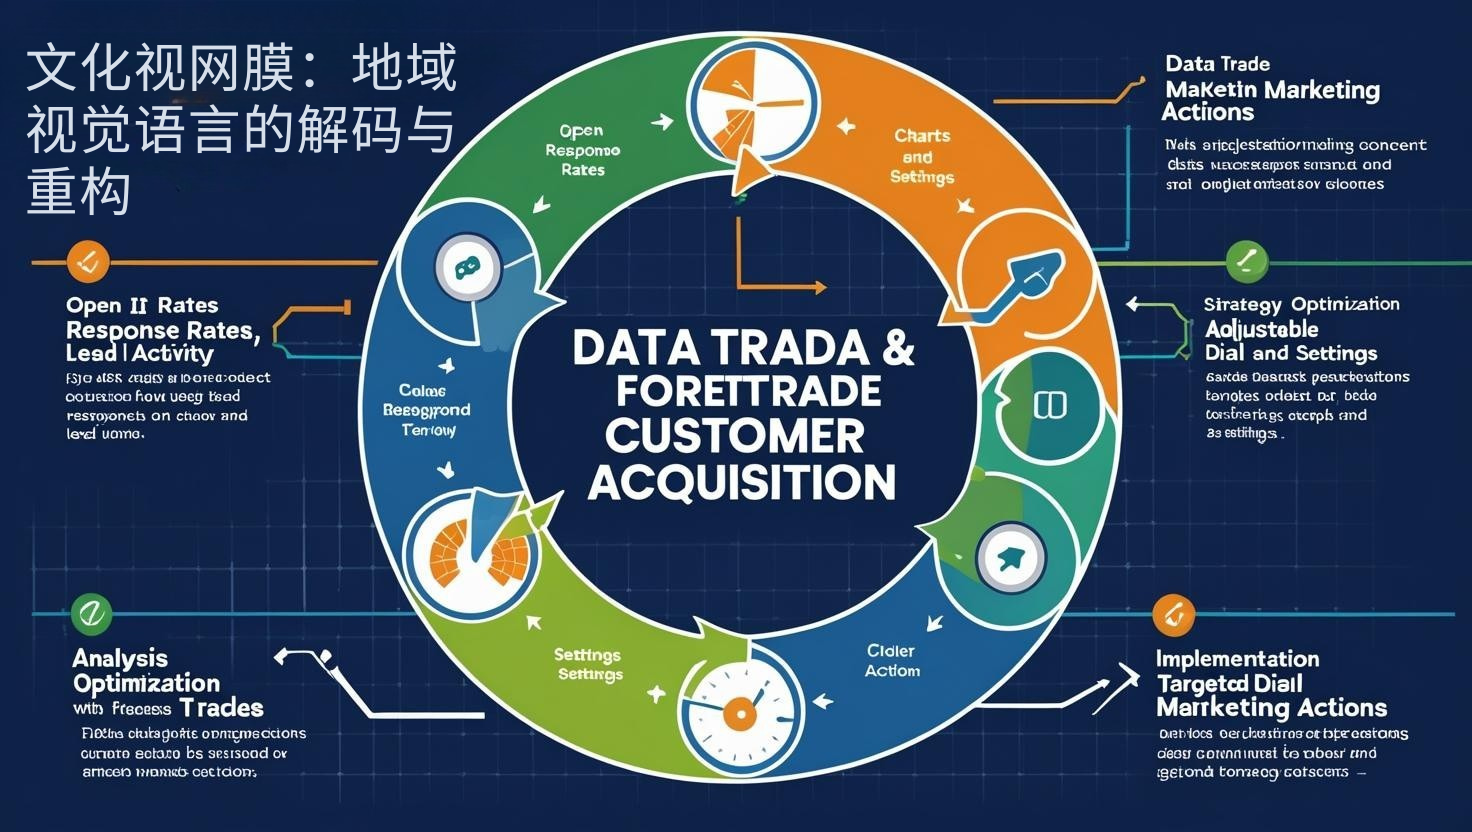 Cultural Retina: Decoding and Reconstructing Regional Visual Language
Visual strategy :
- Color Geography : Digital Applications of Regional Cultural Spectrum
- Symbolic Translation : Modern Design Expression of Traditional Elements
- Dynamic landforms : Interactive visual representation of geographical features
- Font Mood : Conveying Regional Character through Typography
Immersive effect :
- First-screen dwell time increased by 250%.
- Page depth browsing increased by 180%
Space-time folding design: multi-dimensional scene integration
Experience Architecture :
- Solar Terms Algorithm : Dynamic Interface Adaptation to Natural Rhythms
- Scenario Bridging : Seamless Integration of Online Shopping and Offline Life
- Historical Layers : Unfolding the Time Dimension of Regional Culture
- Future Preview : Localized Applications of AR/VR
Scenario Value :
- User engagement increased by 300%
- Content sharing rate increased by 220%
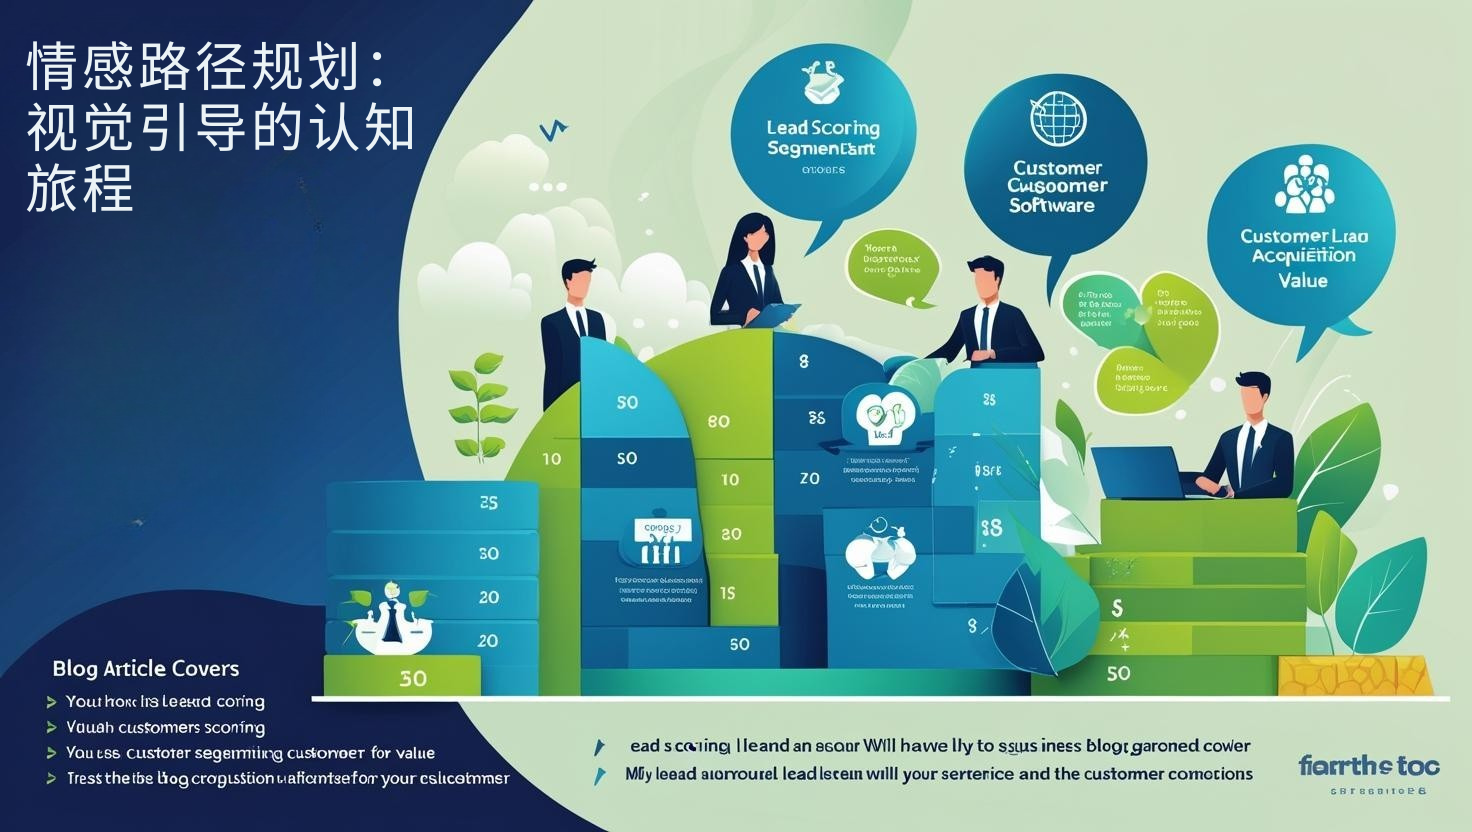 Emotional Path Planning: A Visually Guided Cognitive Journey
Traffic flow design :
- View heatmap : Algorithm optimization of regional browsing habits
- Storyboarding : Pace Control in Brand Narrative
- Mood Curve : Peak Design for User Experience
- Memory Anchors : Highly Recognizable Visual Symbols
Guiding effectiveness :
- Conversion path completion rate increased by 200%
- Brand recall rate reached 92%.
Intelligent Vision Systems: A Dynamically Adaptive Interface Ecosystem
Response mechanism :
- Device DNA : Automatic Adaptation of Terminal Characteristics
- Network awareness : Intelligent optimization of loading speed
- Behavioral prediction : Visual response to user intent
- A/B Evolution : Continuous Optimization of Interface Elements
System advantages :
- Bounce rate reduced by 65%
- Cross-device consistency reaches 95%.
Data visualization storytelling: the captivating expression of complex information
Presenting Art :
- Geographic data : Dynamic maps of regional markets
- Process Aesthetics : The Visual Story of the Supply Chain
- Digital Emotion : The Personification of Statistical Data
- Comparative Design : A Visual Comparison of Competitive Advantages
Communication efficiency :
- Information absorption rate increased by 400%
- Decision-making speed increased by 50%
Start your visual revolution
Pinshop system provides: ✅ Cultural visual decoding ✅ Spatiotemporal scene design ✅ Emotional flow planning ✅ Intelligent interface adaptation ✅ Data narrative engineering
Visit the Pinshop website now
Recommended article: Multilingual Independent Website Strategy: Balancing Localization and Internationalization