In the increasingly competitive global e-commerce environment, user experience has become a key differentiator for the success of cross-border enterprises. According to Baymard Institute research, the average shopping cart abandonment rate of e-commerce websites is as high as 69.57%, of which 26% are directly attributed to UI/UX obstacles such as complex checkout processes and navigation issues. What is even more worrying is that Forrester data shows that 88% of online shoppers say they won’t go back to websites that provide a bad user experience, which is particularly impacted on cross-border businesses that rely on repeat customers. For foreign trade companies that operate self-built websites, systematic UI/UX audits can not only discover these hidden experience obstacles, but also provide clear optimization paths. It is particularly noteworthy that according to McKinsey's research, companies focusing on user experience have a shareholder return of about 32% higher than the industry average, while internal data shared by Amazon's former vice president shows that every 100 milliseconds of page loading time decreases, the conversion rate increases by 1%. For cross-border e-commerce, the cumulative effect of this subtle optimization is particularly significant, as cultural differences and language barriers have increased the complexity of the user experience. This article will explore how to systematically discover and solve user experience barriers for cross-border e-commerce websites through structured UI/UX audit methods, establish a truly customer-centric digital experience, and improve conversion rates and customer loyalty.
 UI/UX Audit Methodology: Systematic Experience Evaluation Framework
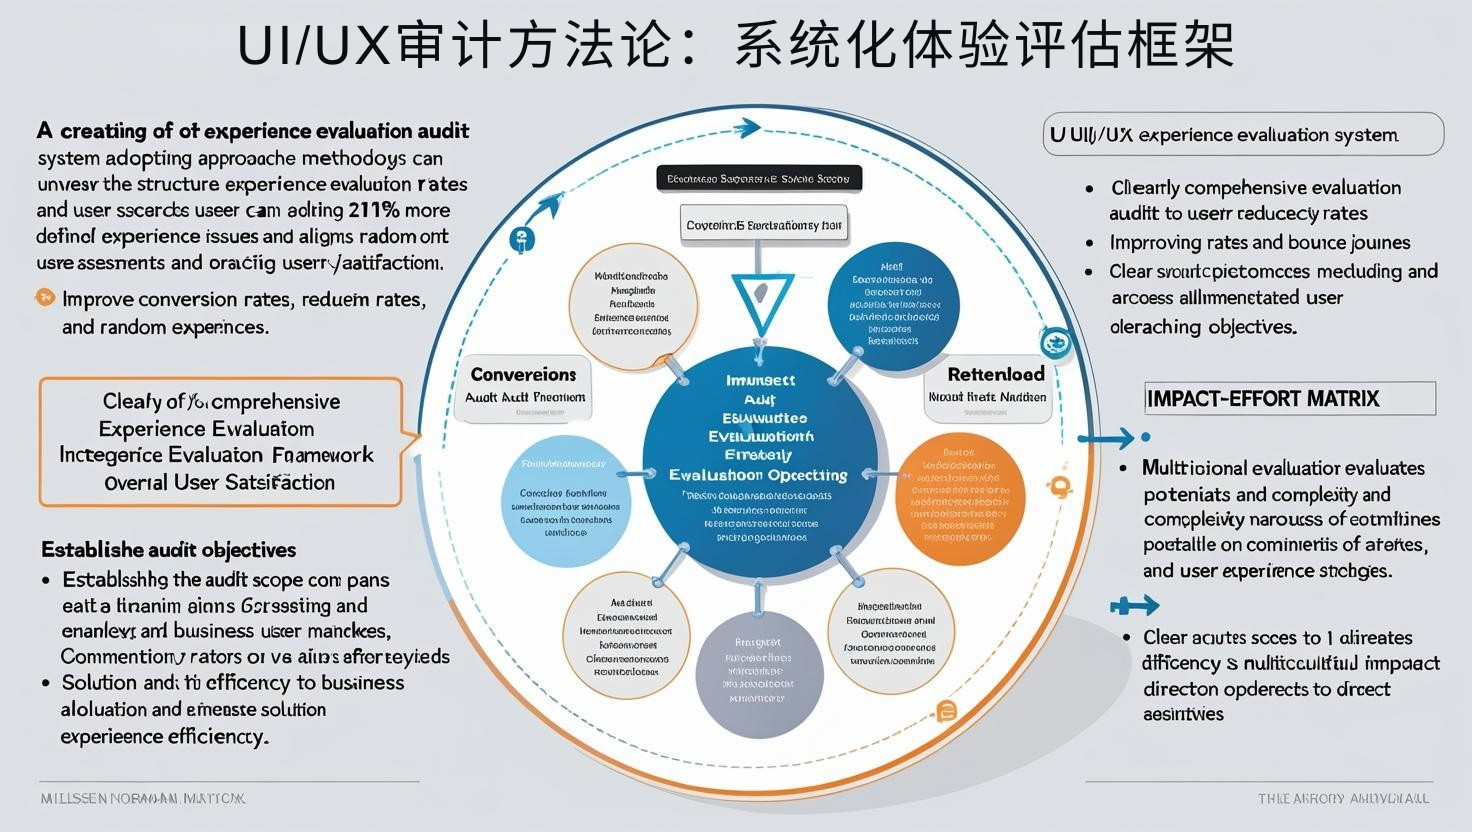
Methodology determines audit results. According to Nielsen Norman Group's research, the structured audit methodology found 215% more user experience problems than temporary assessments, while increasing the efficiency of solution implementation by about 67%.
Build a comprehensive experience evaluation system
-
Audit scope and target definition: Clearly define audit goals, such as increasing conversion rates, reducing bounce rates or increasing satisfaction; create a complete audit scope, including all key pages and user journeys; develop clear success criteria and expected results; establish clear links to business goals; consider the special needs of different user groups and markets; design an evaluation framework to balance comprehensiveness and depth; pay special attention to multilingual and multicultural considerations for cross-border services. An efficient strategy is the "Impact-Effort Matrix", which evaluates the potential impact and solution complexity of different problem areas in advance, and studies show that this approach can increase resource allocation efficiency by about 35%, ensuring focus on high-value opportunities.
-
Multidimensional evaluation method: Integrate heuristic evaluation, expert analysis and user testing to create a comprehensive perspective; design a list of evaluation criteria that meet cross-border characteristics; use competitor analysis to establish industry benchmarks; consider using cognitive drills to evaluate mission-critical processes; implement usability testing to verify actual user experience; combine quantitative data and qualitative insights; pay special attention to behavioral differences among users in different cultural backgrounds. The study shows that audits combining more than three evaluation methods find 85% more critical problems than a single method on average, while significantly improving the effectiveness of solutions as they provide a more comprehensive understanding of the problem.
-
Data-based experience analysis: Use website analysis data to identify user behavior patterns and problem areas; analyze heat maps and conversation recordings to understand actual interactive behaviors; examine form abandonment and error patterns, identify friction points; study search query and result interactions to understand information acquisition barriers; analyze device-specific usage patterns and problems; use funnel analysis to identify conversion breakpoints; pay special attention to performance differences between different markets and traffic sources. A powerful strategy is "behavioral segmentation analysis", which creates segmented groups based on user behavior patterns and analyzes their specific experience barriers, and studies show that this approach can reveal about 43% more user experience insights than overall analysis.
 Key experience indicators: User experience measurement of independent foreign trade websites
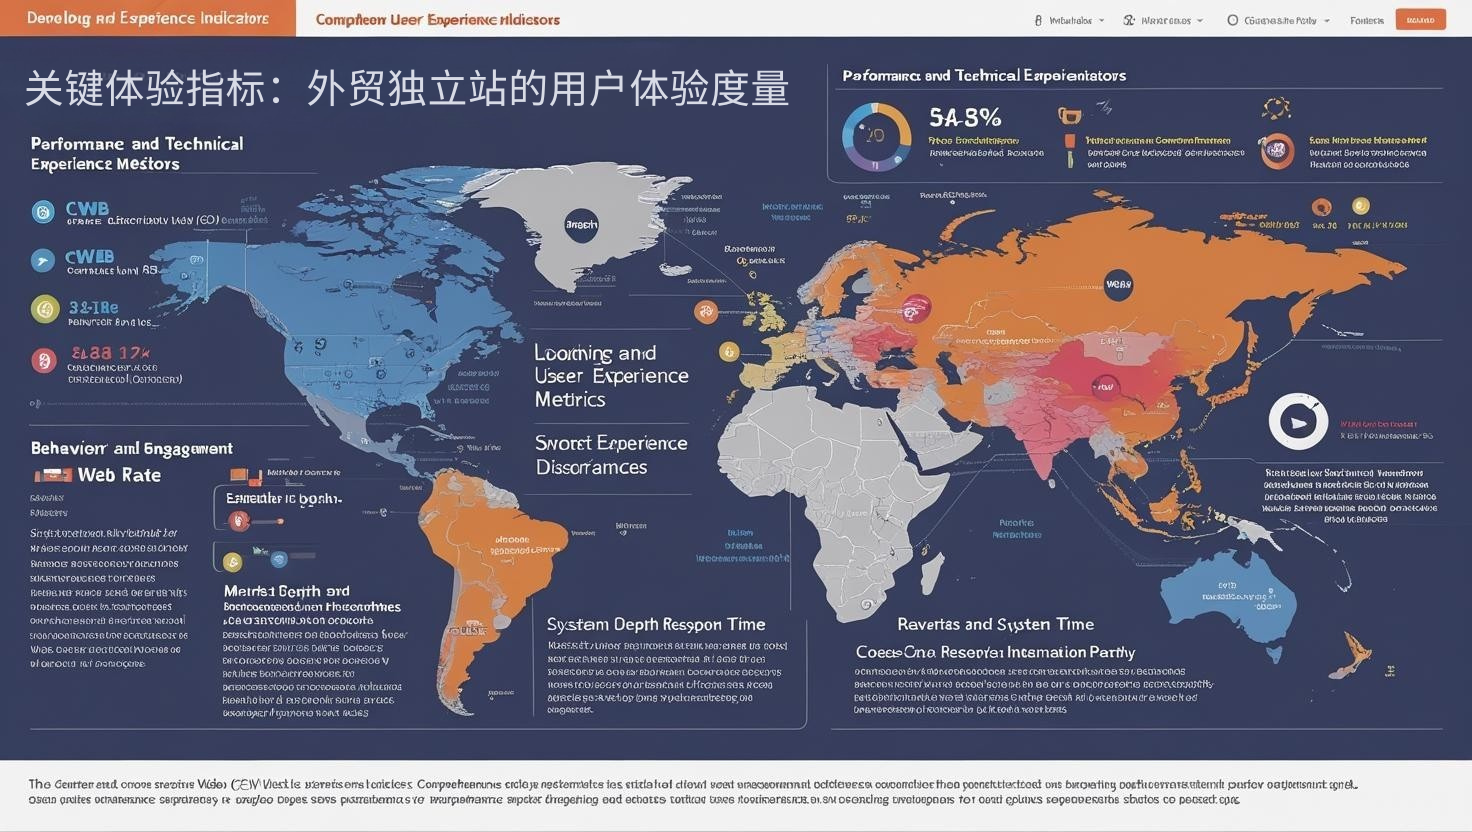
Indicator selection determines the optimization direction. According to Gartner's research, companies that clearly define experience metrics achieve an average of 40% higher return on user experience investment than companies that improve intuitively.
Build a meaningful experience measurement system
-
Performance and technical experience indicators: Monitor core web vitals, such as maximum content drawing, first input latency and cumulative layout offset; analyze loading performance under different market and network conditions; examine differences in mobile experience performance; evaluate functional consistency across browsers and devices; monitor error rates and system response time; evaluate completion time of forms and interactions; pay special attention to technical experience differences among international visitors. A key measurement is the "market-specific performance benchmark", which sets differentiated standards based on network conditions and equipment characteristics in different regions. Research shows that this method reflects the real user experience more accurately than the global unified standards, and can improve performance optimization targeting by about 35%.
-
Behavior and interactive experience indicators: Analyze page depth and dwell time, evaluate content attractiveness; monitor scroll depth and reading mode, understand content consumption behavior; examine navigation paths and page flow, evaluate information architecture effectiveness; analyze click maps and heat maps, identify interaction modes; evaluate search usage frequency and success rate; monitor task completion rate and path efficiency; pay special attention to behavioral differences in traffic from different sources. Research shows that firms that deeply analyze behavioral metrics find an average of 47% more user experience improvement opportunities than firms who only focus on conversion metrics, because they provide a richer user intention and behavior context.
-
Attitude and perceptual experience indicators: Implement customer satisfaction (CSAT) and net recommendation value (NPS) tracking; consider using user effort scores (CES), assessing task difficulty perception; collecting page-level feedback and emotional responses; analyzing customer support interactions and FAQs; assessing social media mentions and sentiment analysis; collecting specific experience feedback using targeted surveys; and paying special attention to the expectations of users from different cultural backgrounds. A high-value measure is "emotional journey mapping", tracking emotional changes at each stage of the user's journey, and studies show that this approach can provide 35% more experiential insight than static satisfaction metrics, especially in identifying high emotional impact points.
 Conversion path analysis: User journey obstacle diagnosis
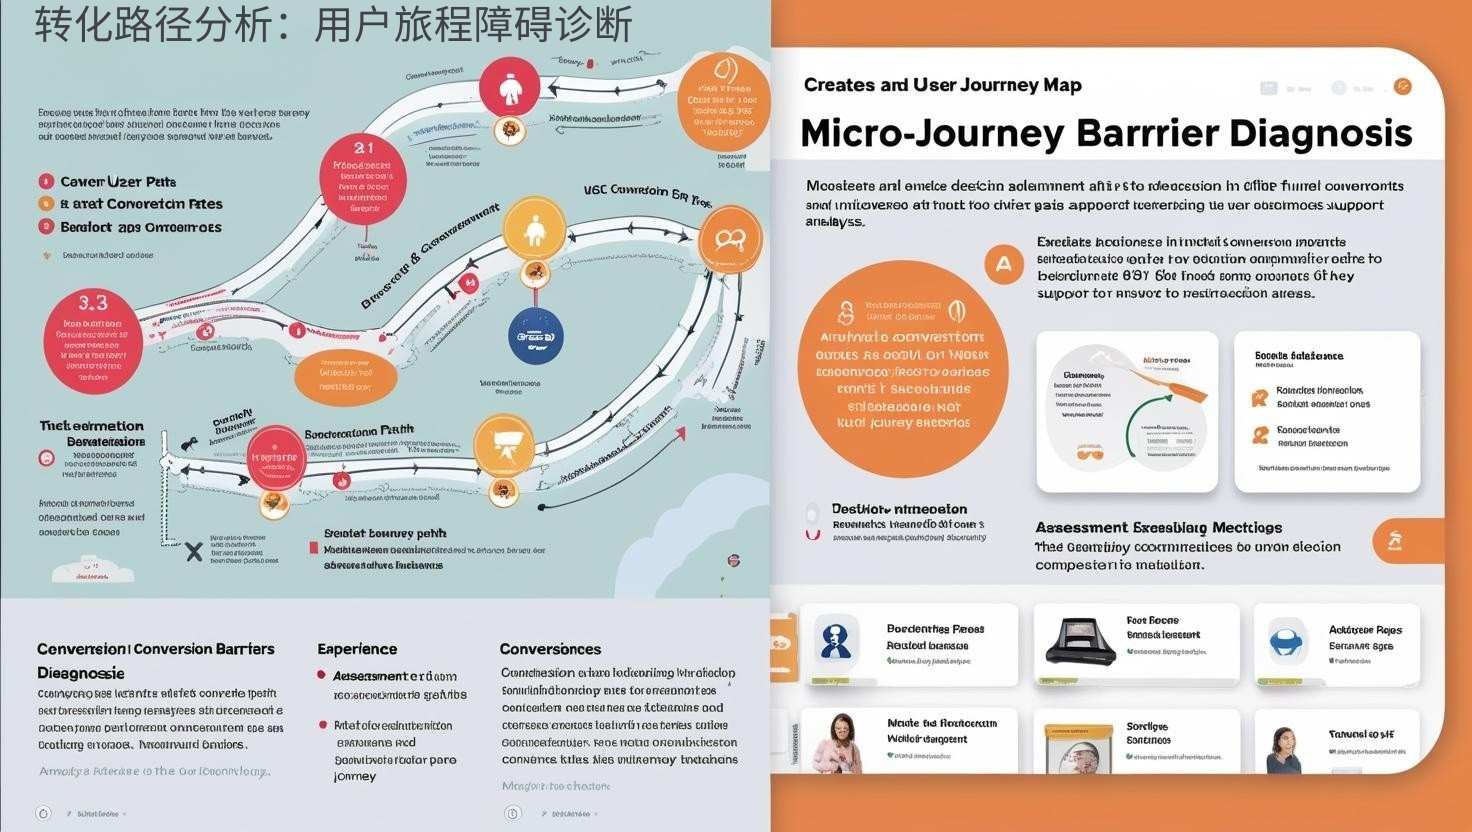
The conversion path directly affects performance. According to Econsultancy's research, systematic conversion path optimization can improve business conversion rate by 50-200% on average, and user journey obstacle repair is the type of optimization that has the greatest impact.
Build barrier-free user conversion paths
-
Key transformation path analysis: Draw a detailed user journey map to identify all key steps and contact points; analyze conversion and abandonment rates at each stage; identify high churn points and experience breaks; examine path differences between different traffic sources and user groups; analyze device-specific conversion barriers; use funnel visualization technology to highlight problem areas; pay special attention to market-specific conversion paths for cross-border services. One advanced analysis is "Microjourney Obstacle Diagnosis", which breaks down key transformation steps into micro-interactions and analyzes the completion rate of each interaction, and studies show that this fine-grained analysis can find specific obstacle points 67% more than traditional step analysis.
-
Decision barriers and trust elements: Analyze the information architecture and decision-making support elements of the product page; evaluate the display effect of trust signs and social proofs; examine the clarity of price presentation and promotional information; analyze the decision-making support effect of product pictures and videos; evaluate the integrity and persuasiveness of product descriptions; examine the transparency of international payment and logistics information; pay special attention to the differences in trust establishment from different cultural backgrounds. Research shows that firms optimizing decision support elements receive an average of 32% higher conversion improvements than firms focusing solely on technical barriers, proving that psychological barriers are as important as technical barriers.
-
Form and checkout optimization: Analyze form completion rate and field-level abandonment rate; evaluate the effectiveness of error messages and help text; examine the user experience of form length and segmented design; analyze the special challenges of mobile forms; evaluate the automatic filling and information saving functions; examine the international adaptation of address and payment forms; pay special attention to the differences in form experience on different devices. A key strategy is "progressive form design", breaking complex forms into simple logical steps and providing clear progress instructions, and studies show that this approach can increase form completion rate by about 28%, while improving user satisfaction.
 Design and content optimization: practical solutions to experience barriers
Implementing solutions is a key link. According to UX Magazine's research, the main reason why 82% of UX audit projects fail to generate expected business value is poor implementation or lack of priorities.
Build an effective experience optimization implementation plan
-
Visual and interactive design optimization: Create visual hierarchy and focus optimization based on audit discovery; improve color contrast and layout to improve readability and ease of use; optimize interactive elements size and responsiveness to improve mobile experience; simplify navigation structure and improve information search efficiency; improve page layout and reduce cognitive load; design consistent visual language to enhance brand experience; pay special attention to the adaptability of cross-cultural design elements. An efficient strategy is "gradual design improvements", breaking down large design changes into small improvements that can be tested independently, and studies have shown that this approach can increase the success rate of design optimization by about 44%, while reducing business risks.
-
Content and information architecture optimization: Improve content organization and classification, enhance information discovery; optimize product description and feature display, support purchase decisions; simplify complex information and lower the threshold for understanding; improve error information and help texts, and provide positive solutions; design contextual content to provide relevant information when users need it; consider multilingual and cross-cultural content adaptation; pay special attention to content expectations differences among international users. Research shows that companies that optimize content structure and expression receive an average of 27% higher engagement and 23% lower bounce rates than companies that focus solely on visual design, demonstrating the critical role of content in user experience.
-
Testing and verification process: Design A/B testing and multivariate testing plans to verify improvement effects; implement user testing and focus groups to collect qualitative feedback; establish a data-based iterative optimization cycle; design a test priority framework to balance impact and resource requirements; consider segmented testing to verify experience differences among different user groups; implement quality assurance processes to ensure that technology implementation meets design intentions; pay special attention to cross-browser and cross-device consistency testing. A strategic practice is the "impact prediction model", which estimates potential value based on historical data and industry benchmarks. Research shows that this data-driven approach can increase the return on investment of optimized resources by about 38%, ensuring focus on high-value opportunities.
In an increasingly competitive environment for digital commerce around the world, systematic UI/UX audits have become a key strategy for cross-border enterprises to identify and address user experience barriers. By establishing a structured evaluation framework, well-defined experience metrics, analyzing key conversion paths, and implementing effective optimization programs, enterprises can significantly improve user experience and enhance conversion rates and customer loyalty. The key is to view UI/UX audits as a cycle of continuous improvement rather than a one-time project, converting user feedback and behavioral data into specific experience optimization actions.
Related articles recommended:https://pinshop.cn/zh-Hans/blog/what-is-independent-site-for-business